Best time to visit Bali: weather, wet season and travel planning
There is no universal best time to visit Bali. For most of the island, April to October is broadly the drier period and November to March the wetter period. Neither label tells you what will happen on a particular day.
The useful decision is whether you prefer the lower-rainfall side of Bali's seasonal pattern or are comfortable planning around greater rainfall and humidity. Bali also contains several seasonal zones, so one coastal area, inland locality or climate grid point should not be used as a weather promise for the whole island.
Use long-term climate information to choose a broad period. Use BMKG's current locality forecast when your actual dates approach.
Bali Travel Guide
Weather & best time
This article is part of the Bali Travel Guide.
Seasonal overview
Bali weather at a glance
Area
Weather character
May suit travellers who…
What to remember
April to October
Generally the drier part of the year across most of Bali
Put lower historical rainfall high on the list and accept that showers remain possible
Drier does not mean guaranteed sunshine, and conditions still vary by locality
November to March
Generally the wetter part of the year
Can keep plans flexible and are comfortable with higher rainfall and humidity
Wet season does not mean rain falls continuously every day
Seasonal transitions
The broad pattern is changing rather than switching instantly
Prefer to compare a specific month with their trip style
A calendar boundary cannot predict the onset or character of a future season
April to October
Weather character
Generally the drier part of the year across most of Bali
May suit travellers who…
Put lower historical rainfall high on the list and accept that showers remain possible
What to remember
Drier does not mean guaranteed sunshine, and conditions still vary by locality
November to March
Weather character
Generally the wetter part of the year
May suit travellers who…
Can keep plans flexible and are comfortable with higher rainfall and humidity
What to remember
Wet season does not mean rain falls continuously every day
Seasonal transitions
Weather character
The broad pattern is changing rather than switching instantly
May suit travellers who…
Prefer to compare a specific month with their trip style
What to remember
A calendar boundary cannot predict the onset or character of a future season
Temperature changes less across the year than rainfall at the south/central Bali reference point used below. That makes rainfall tolerance and flexibility more useful planning questions than searching for a dramatic cool season.
Bali wet season
November to March is broadly the wetter period for most of Bali. The south/central Bali reference point used below shows its highest corrected precipitation values in this part of the year, particularly January and February, while relative humidity also remains high.
“Wet season” is a climate classification, not shorthand for continuous daily rain. BMKG defines seasonal onset using rainfall accumulated across consecutive ten-day periods. That is a different idea from saying every hour or every day will be wet.
For a holiday, the practical consequence is uncertainty. Outdoor and beach plans may need a flexible order, and current conditions should guide the day rather than an old average. Covered downtime can make the itinerary more resilient, but there is no reliable rule for when rain will start, how long it will last or which specific part of Bali will avoid it.
The wetter period can still suit travellers who value the destination and are comfortable adapting. It is not necessary to sell it as secretly dry, nor to dismiss it as unusable.
Bali drier season
Treat the season boundary as a transition
April and October should not be read as gates that switch the island instantly between two settings. BMKG determines seasonal onset from rainfall observed across consecutive ten-day periods, and onset varies between seasonal zones. A future year may not follow a traveller's simplified calendar exactly.
If your dates sit near a broad season boundary, use the monthly pattern as context and keep more weight on current locality information. This is more honest than relabelling a transition month as reliably wet or reliably dry.
April to October is generally drier across most of Bali. At the south/central Bali grid point used below, corrected precipitation declines from 4.36 mm/day in April to 0.72 mm/day in August, then begins rising again through September and October.
Those figures show a seasonal pattern, not a guarantee of cloudless beach days. Measurable precipitation appears in every month of the gridded climatology. A drier-season trip still needs a current forecast, especially when a particular outdoor plan matters.
The drier period is the clearest starting point if lower historical rainfall is your main priority. It is not automatically the right choice if your dates, preferred setting or tolerance for seasonal variability point elsewhere.
Bali temperatures, rainfall and humidity
This table is not a set of Bali-wide station averages. It uses a NASA POWER/MERRA-2 gridded climatology for one requested south/central Bali point at 8.748°S, 115.167°E, covering 1991–2020.
Temperature is monthly mean air temperature at 2 metres in degrees Celsius. Precipitation is corrected precipitation expressed as an average daily rate in millimetres per day—not a monthly total. Humidity is mean relative humidity at 2 metres. The point helps illustrate the seasonal shape, but its coarse grid cannot establish precise differences between nearby resort areas or inland Ubud.
Month
Mean temperature
Corrected precipitation
Mean relative humidity
Planning context
January
25.5°C
10.00 mm/day
85.9%
Highest precipitation value in this reference
February
25.4°C
8.84 mm/day
86.7%
Wet and most humid part of this point's annual pattern
March
25.6°C
6.12 mm/day
85.7%
Still within the broadly wetter period
April
25.6°C
4.36 mm/day
85.5%
Transition into the broadly drier period
May
25.0°C
2.40 mm/day
84.8%
Lower rainfall rate than April
June
24.2°C
1.57 mm/day
84.4%
Drier-season context with slightly lower mean temperature
July
23.5°C
1.09 mm/day
83.0%
Among the lowest rainfall and temperature values
August
23.5°C
0.72 mm/day
81.0%
Lowest corrected precipitation value in this reference
September
24.4°C
1.14 mm/day
79.5%
Rainfall begins rising from the August low
October
25.6°C
2.30 mm/day
78.8%
Warmer transition before the broadly wetter period
November
26.2°C
4.68 mm/day
80.7%
Highest mean temperature in this reference and rising rainfall
December
25.8°C
8.14 mm/day
83.8%
Wetter-season context
January
Mean temperature
25.5°C
Corrected precipitation
10.00 mm/day
Mean relative humidity
85.9%
Planning context
Highest precipitation value in this reference
February
Mean temperature
25.4°C
Corrected precipitation
8.84 mm/day
Mean relative humidity
86.7%
Planning context
Wet and most humid part of this point's annual pattern
March
Mean temperature
25.6°C
Corrected precipitation
6.12 mm/day
Mean relative humidity
85.7%
Planning context
Still within the broadly wetter period
April
Mean temperature
25.6°C
Corrected precipitation
4.36 mm/day
Mean relative humidity
85.5%
Planning context
Transition into the broadly drier period
May
Mean temperature
25.0°C
Corrected precipitation
2.40 mm/day
Mean relative humidity
84.8%
Planning context
Lower rainfall rate than April
June
Mean temperature
24.2°C
Corrected precipitation
1.57 mm/day
Mean relative humidity
84.4%
Planning context
Drier-season context with slightly lower mean temperature
July
Mean temperature
23.5°C
Corrected precipitation
1.09 mm/day
Mean relative humidity
83.0%
Planning context
Among the lowest rainfall and temperature values
August
Mean temperature
23.5°C
Corrected precipitation
0.72 mm/day
Mean relative humidity
81.0%
Planning context
Lowest corrected precipitation value in this reference
September
Mean temperature
24.4°C
Corrected precipitation
1.14 mm/day
Mean relative humidity
79.5%
Planning context
Rainfall begins rising from the August low
October
Mean temperature
25.6°C
Corrected precipitation
2.30 mm/day
Mean relative humidity
78.8%
Planning context
Warmer transition before the broadly wetter period
November
Mean temperature
26.2°C
Corrected precipitation
4.68 mm/day
Mean relative humidity
80.7%
Planning context
Highest mean temperature in this reference and rising rainfall
December
Mean temperature
25.8°C
Corrected precipitation
8.14 mm/day
Mean relative humidity
83.8%
Planning context
Wetter-season context
The small annual temperature range should not be mistaken for identical daily conditions. Likewise, high mean humidity does not describe every hour. These values are best used to understand the overall curve rather than to manufacture precise promises for a resort or travel week.
How to read the monthly pattern
Use the table to compare broad parts of the year, not to select dates from decimal differences. January and August show the clearest precipitation contrast at this point. Adjacent months often represent a gradual transition, and the precision of a gridded dataset does not make a future day’s weather equally precise.
The precipitation column also needs particular care. A value in mm/day is a monthly average daily rate. It is not the amount that must fall each day, and multiplying it into a monthly total would still not reveal whether rain arrived across many events or a smaller number of heavier ones. For a traveller, its value is comparative: it shows how the long-term rainfall signal rises and falls through the year.
Temperature is comparatively steady, while the humidity values remain high throughout the series. That combination means a “drier month” is not the same as a cool, dry climate. If warmth or humidity is uncomfortable for you, do not focus on rainfall alone.
There are three separate decisions:
Use the broad wet/drier pattern to choose a part of the year.
Use the places in your itinerary to identify which local forecasts will matter.
Use BMKG's current information near travel to make day-level choices.
Keeping those steps separate prevents a historical grid value from being treated as a promise for a beach, hotel or Ubud activity.
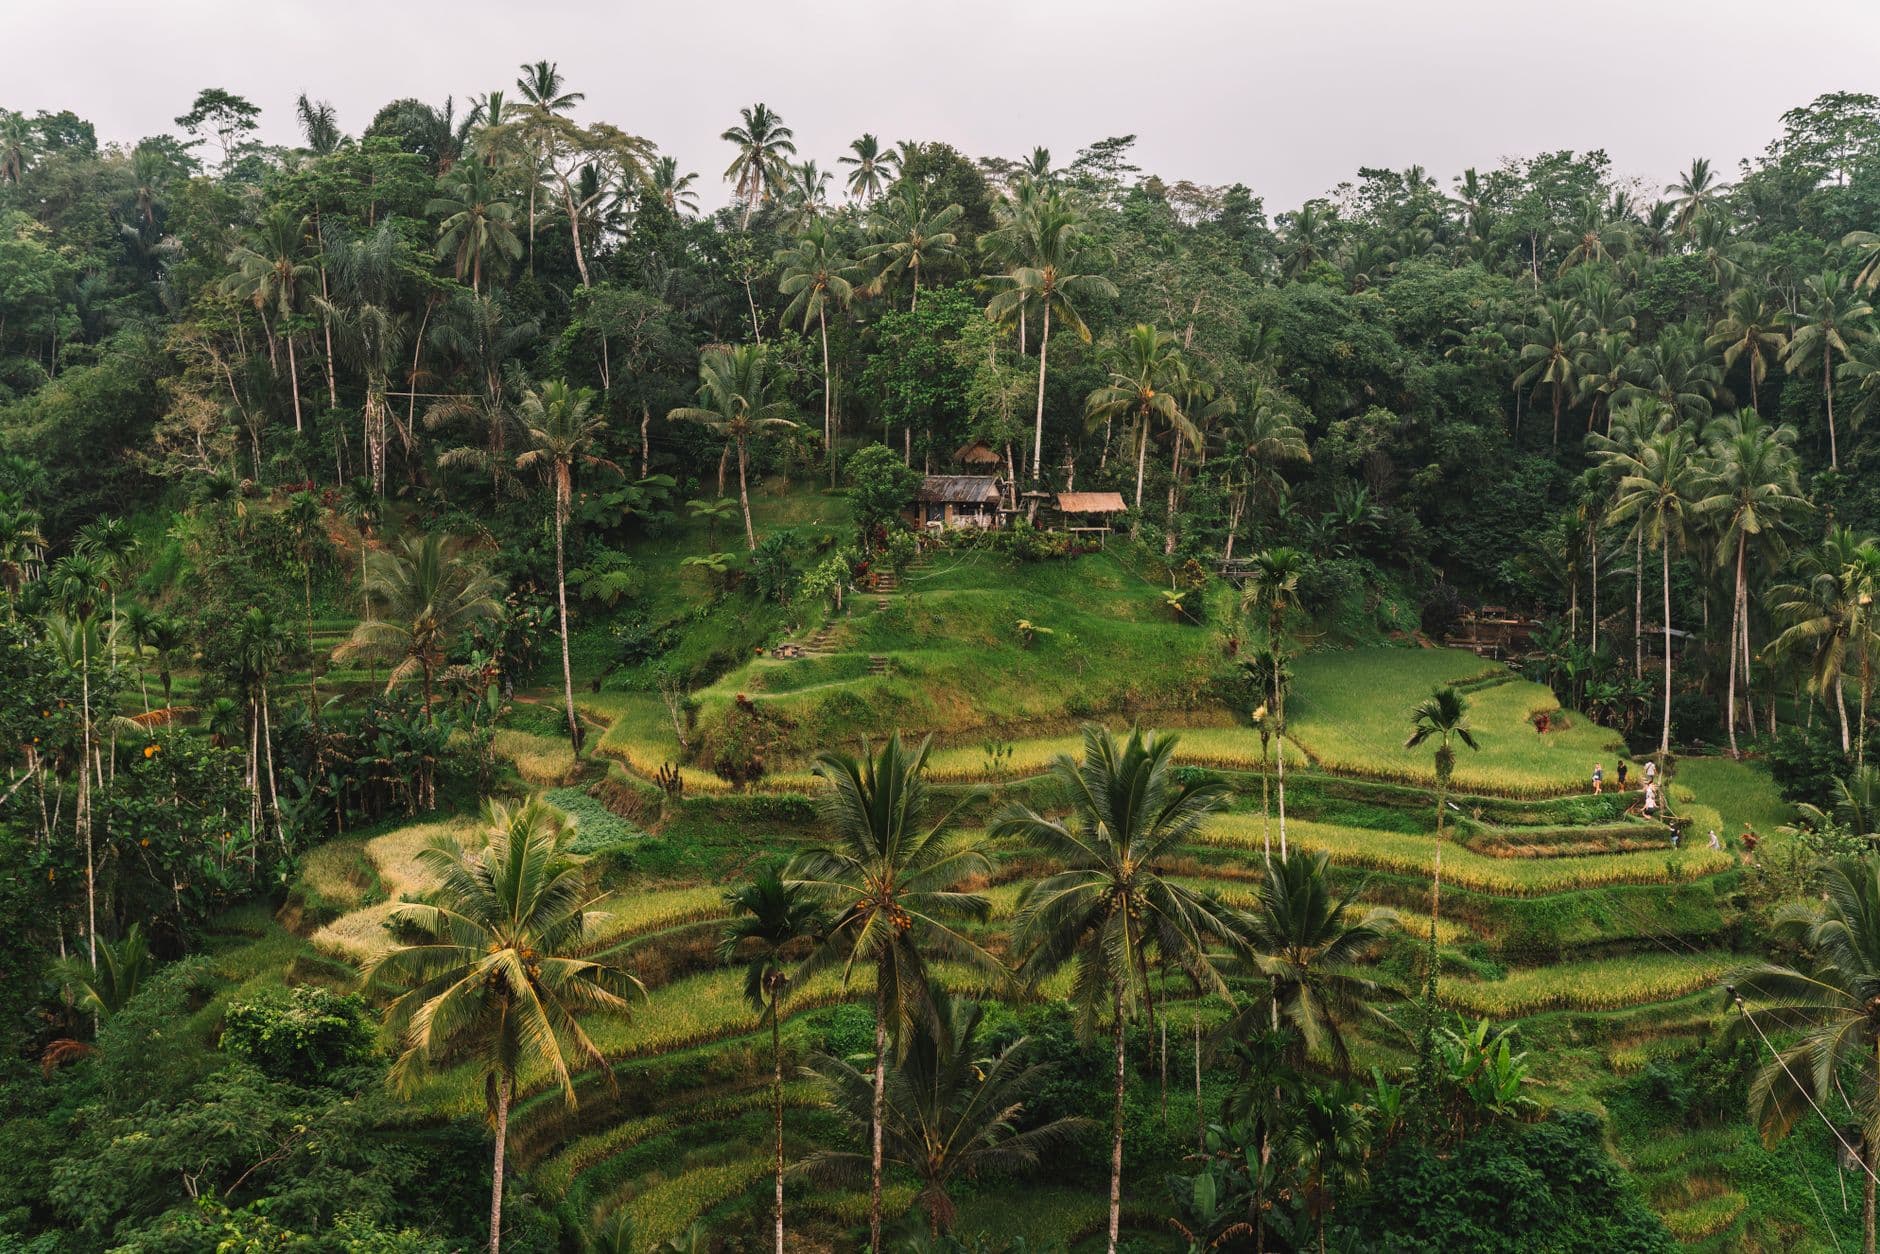
Rice terraces in Ubud illustrate an inland Bali setting, not expected rainfall or sunshine.
Yes, and the strongest reason to be cautious is BMKG's own seasonal framework. Bali is divided into 20 seasonal zones under the 1991–2020 normal framework. These zones describe climate behaviour rather than simply following tourist-area or administrative boundaries.
That means “Bali weather” is necessarily broad. Conditions in the places on a multi-stop itinerary do not have to be identical, and the timing of seasonal onset can vary. Reliable data does not justify a neat ranking that declares one named resort district a fixed percentage drier than another.
The coastline and inland Ubud are also different trip settings. One may put beach time at the centre of the day; the other may put inland landscapes and activities higher on the list. That changes the consequences of rain for your plans, but it does not prove a universal weather hierarchy between them.
Check BMKG's forecast for the actual localities in your itinerary rather than applying one island-level icon or one grid point everywhere.
Is Bali worth visiting in the wet season?
It can be, if the trip still works when rainfall and humidity have more influence over the day. That is a personal trade-off rather than a yes-or-no fact about the destination.
Start with the plans that are hardest to move. If a beach day or another outdoor experience is central, allow room to respond to the local forecast instead of fixing every activity into a tight sequence. If your accommodation and itinerary can absorb changed conditions, wet-season variability may be easier to accept.
Do not base this decision on claims that rain always arrives at one time or clears after a predictable interval. Bali has a wetter broad season, high humidity and local variation, but individual rain events do not follow a reliable timetable.
Prices, crowd levels, events and surf conditions may also affect the decision, but those factors are separate from the climate information used here. Keeping those questions separate avoids drawing conclusions the climate data cannot support.
Beach stay or Ubud?
Choose between beach and inland time for the experience you want, then apply weather planning to that choice. Coastal visitor areas and inland Ubud are distinct trip settings, but that does not mean one will always be dry while the other will be wet.
For a beach-first stay, the weather decision may centre on how much flexibility you have around outdoor time. For an Ubud-focused stay, it may centre on how you sequence inland plans and how comfortable you are with humidity and rainfall. For a mixed itinerary, check each locality rather than assuming the first forecast covers the whole trip.
Area and accommodation choice are separate from a climate ranking. Compare them on their actual holiday character, then use current BMKG information for the weather question.
So, when should you go?
Use these scenarios as a starting point:
If lower historical rainfall matters most: begin with the April-to-October drier period, then look at the monthly reference and your specific localities.
If your dates fall from November to March: plan for the wetter pattern and high humidity without assuming every day will be lost to rain.
If you are planning a beach-first trip: give yourself room to respond to local forecasts; a broad seasonal label cannot guarantee beach conditions.
If you are spending meaningful time inland: treat Ubud as its own trip setting, but do not attach unsupported rainfall claims to it.
If you dislike humidity or weather uncertainty: compare the historical curve honestly and keep the most weather-sensitive plans flexible.
No option removes uncertainty. The best fit is the period whose broad pattern works with your priorities, places and willingness to adapt.
Planning where to stay?
After choosing a broad travel period, compare Bali's resort areas and accommodation styles on their actual setting and practical fit. Do not use this weather guide to invent a climate winner between areas.
We checked Bali's broad seasonal pattern and regional caveats against official weather and tourism sources. The numerical table uses a clearly identified gridded climatology reference.
The numerical reference is one gridded point—not a weather station, a Bali-wide average or proof of precise differences between tourist areas. BMKG is the source for current locality forecasts.
Bali Travel Guide
Continue planning your Bali trip
Move between the published Bali guides without losing your place in the planning process.
Next step
Choose your travel period, then compare stays
Once you understand when you want to travel, compare current Bali accommodation for those dates.
Check Bali accommodation
Choose future dates to compare current accommodation pricing and availability through Expedia.
You’ll continue to Expedia to see its current pricing and availability.