
Summer: December–February
- Typical planning context
- Long daylight, outdoor sightseeing and walking
- Weather character
- The year's warmest typical nights
- What to remember
- Warm-season travel still needs flexible layers and a current forecast
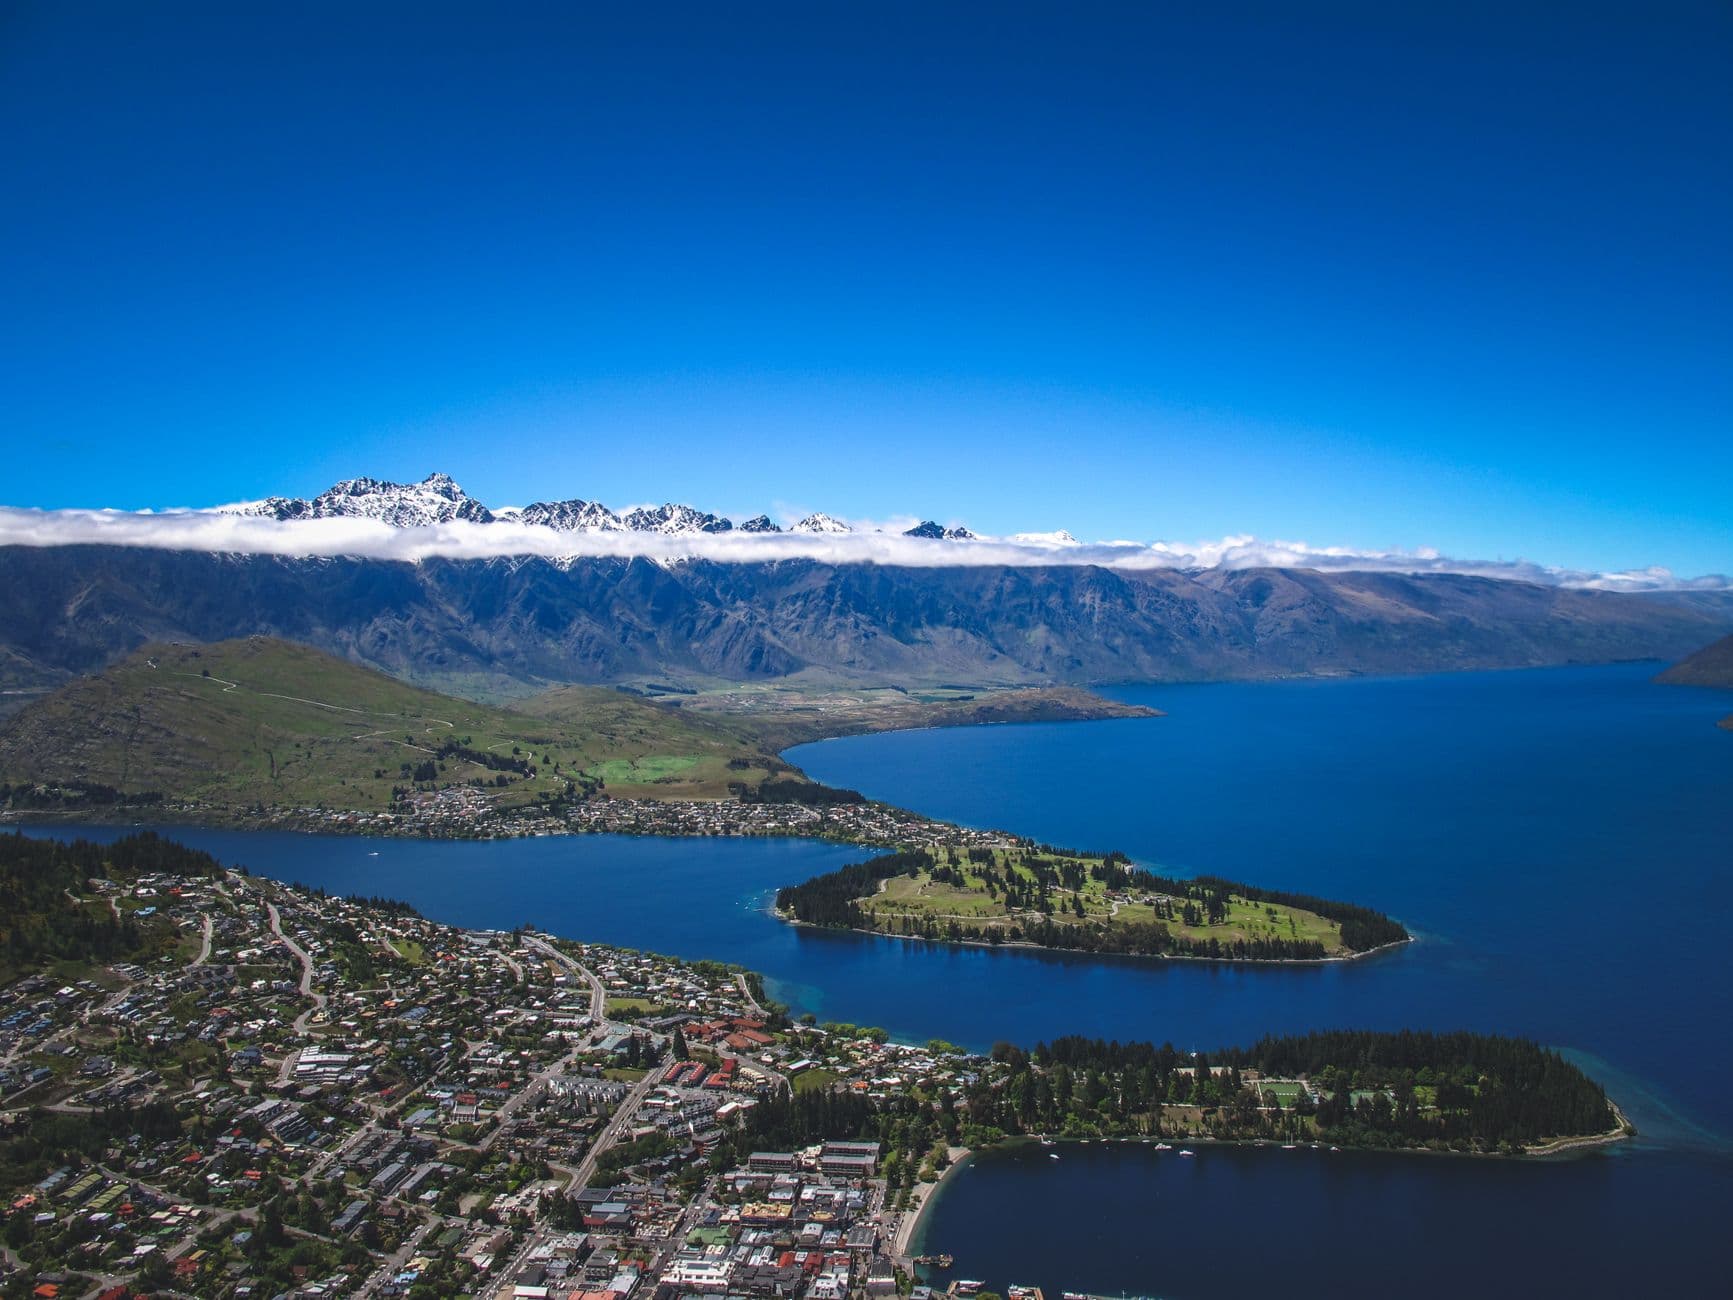
Photo by Francesco Ungaro on Pexels
Queenstown seasons guide
There is no single best time to visit Queenstown. The right season depends on whether you want snow sports, warmer outdoor sightseeing, autumn colour, spring conditions or the longer daylight of summer.
Weather remains changeable in every season. Queenstown town, the surrounding valleys and the mountains can experience different conditions, so choosing a season narrows the kind of trip you are planning; it does not predict the weather on your dates.
Queenstown Travel Guide
This article is part of the Queenstown Travel Guide.
Season comparison
| Area | Typical planning context | Weather character | What to remember |
|---|---|---|---|
| Summer: December–February | Long daylight, outdoor sightseeing and walking | The year's warmest typical nights | Warm-season travel still needs flexible layers and a current forecast |
| Autumn: March–May | Cooling days and seasonal colour | A transition from summer warmth towards colder mornings and nights | Foliage timing and daily weather cannot be guaranteed |
| Winter: June–August | Snow sports and cold-weather travel | The coldest typical overnight temperatures; snow is possible | Mountain snow does not guarantee settled snow in town |
| Spring: September–November | Longer days and a transition towards warmer conditions | Changeable weather, with valley and mountain conditions potentially differing | Winter-like and milder conditions can overlap |
Choose the experience first, then check current conditions near travel. Historical climate can help with the first decision; it cannot do the second job.
This guide uses climate normals for planning. NIWA describes climate normals as long-term statistics, typically calculated over 30 years. They show what has been typical at a named weather station over a defined reference period.
A forecast answers a different question: what conditions are expected over the coming days. If you are deciding between a summer and winter holiday, historical climate information is useful. If you are deciding what to wear tomorrow, whether a road journey is sensible or what conditions a ski field currently has, use the latest official forecast and operator information.
The numerical data below comes from NIWA's Queenstown station 5446. The latest available mean daily minimum series uses the 1991–2020 normal period. The latest rainfall series available for this station uses 1981–2010. The two periods are labelled separately in the table rather than being presented as one dataset. Neither source provides a compatible maximum-temperature series for this comparison, so this guide does not invent one or borrow one from a different station.
NIWA's Otago climate report also contains Queenstown Airport data. That is a different series. Keeping the station and period attached to every figure is more important than building a fuller-looking table from incompatible records.
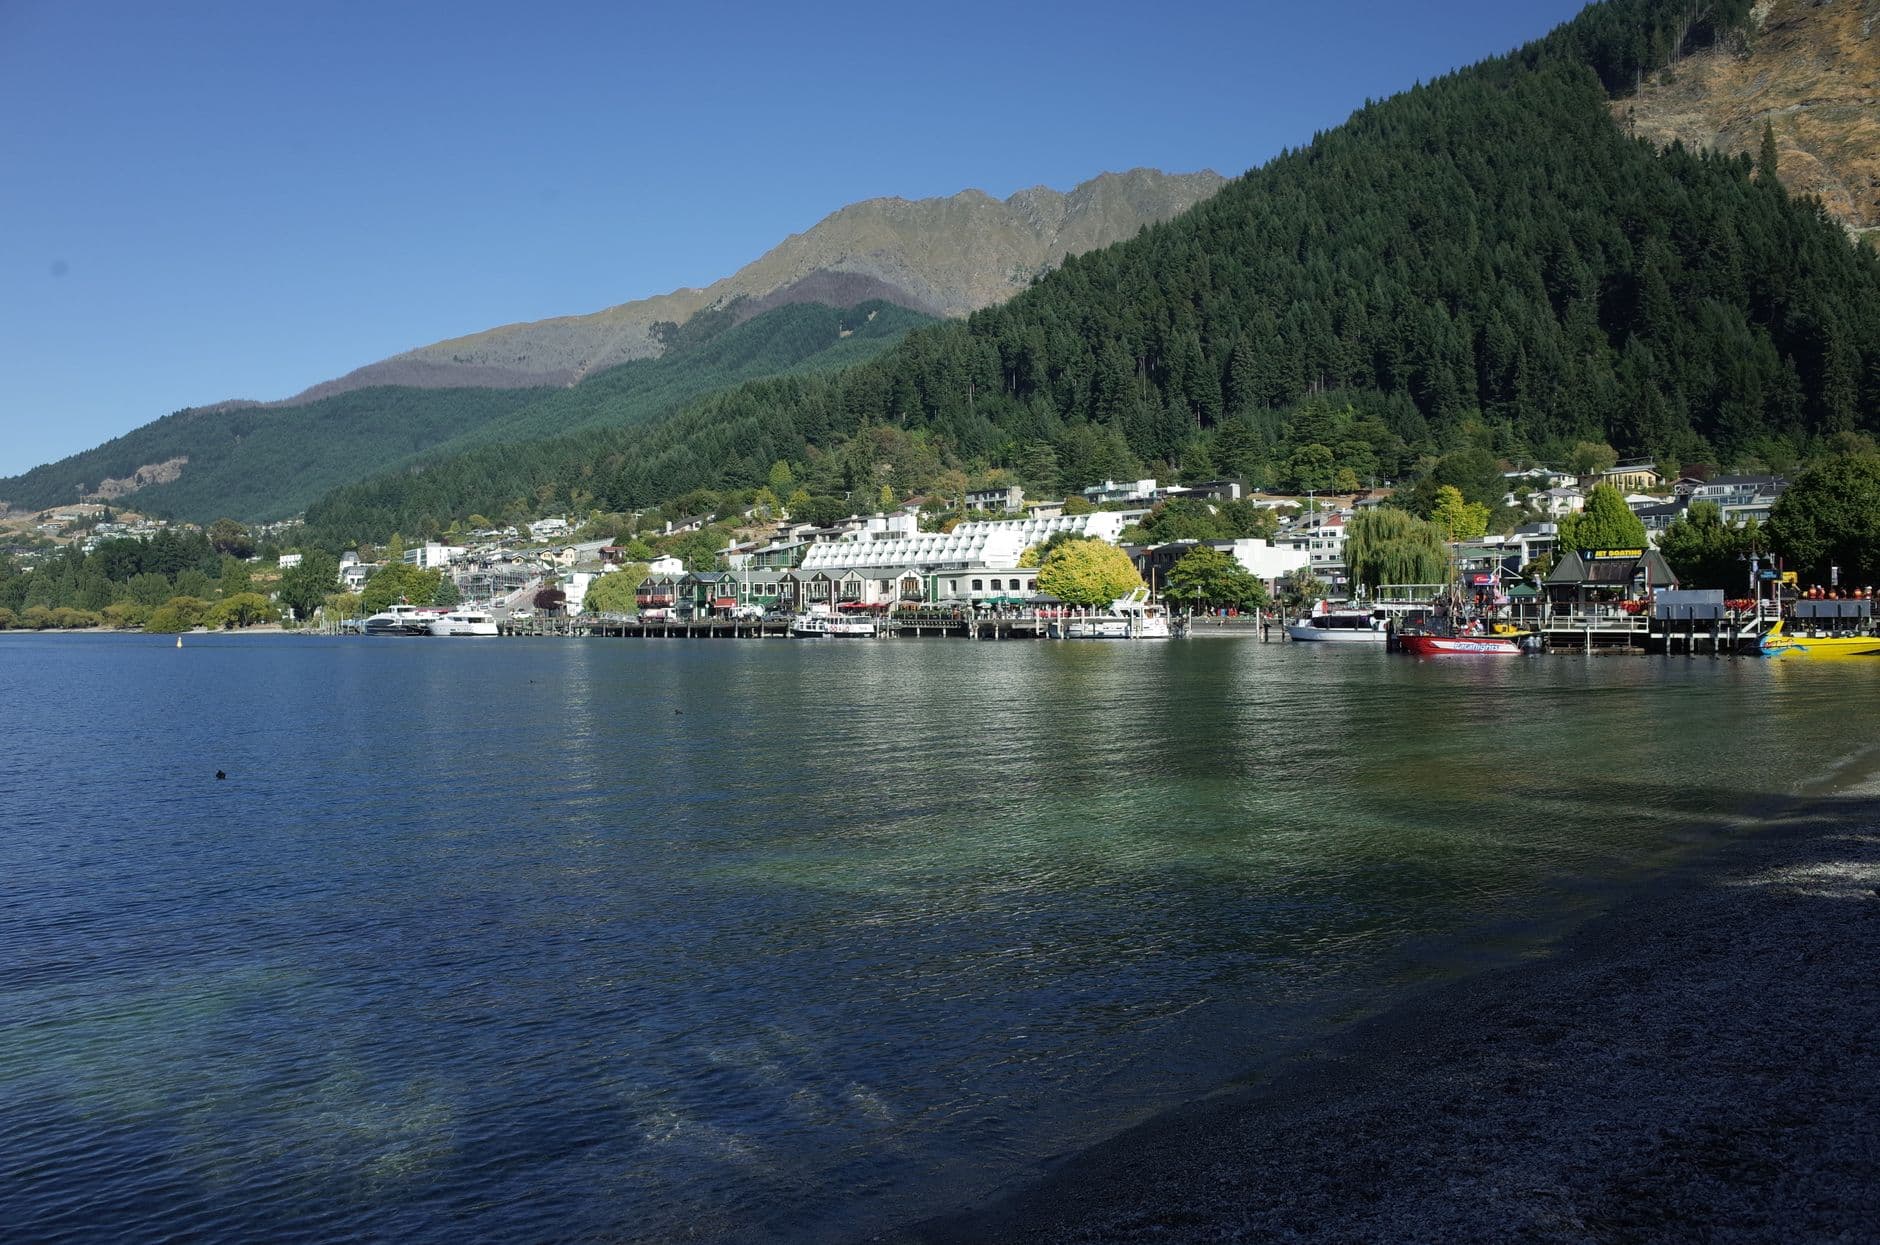
Photo by mingche lee on Pexels
Summer runs from December to February and gives Queenstown its longest daylight. It is the clearest starting point for travellers who want outdoor sightseeing and walking to shape the trip without making snow sports the main purpose.
At station 5446, the 1991–2020 mean daily minimum is 9.6°C in December, 11.0°C in January and 10.6°C in February. These are averages of daily minimum temperatures at that station, not a statement that every night stays near those values. A warm-looking seasonal photograph or a long-range average is not a reason to leave flexible layers behind.
Summer also does not mean reliably dry. The same station's 1981–2010 rainfall normals are 84.8 mm in December, 80.5 mm in January and 61.4 mm in February. Those totals describe historical months, not how rain was distributed across individual days or what will happen in a future year.
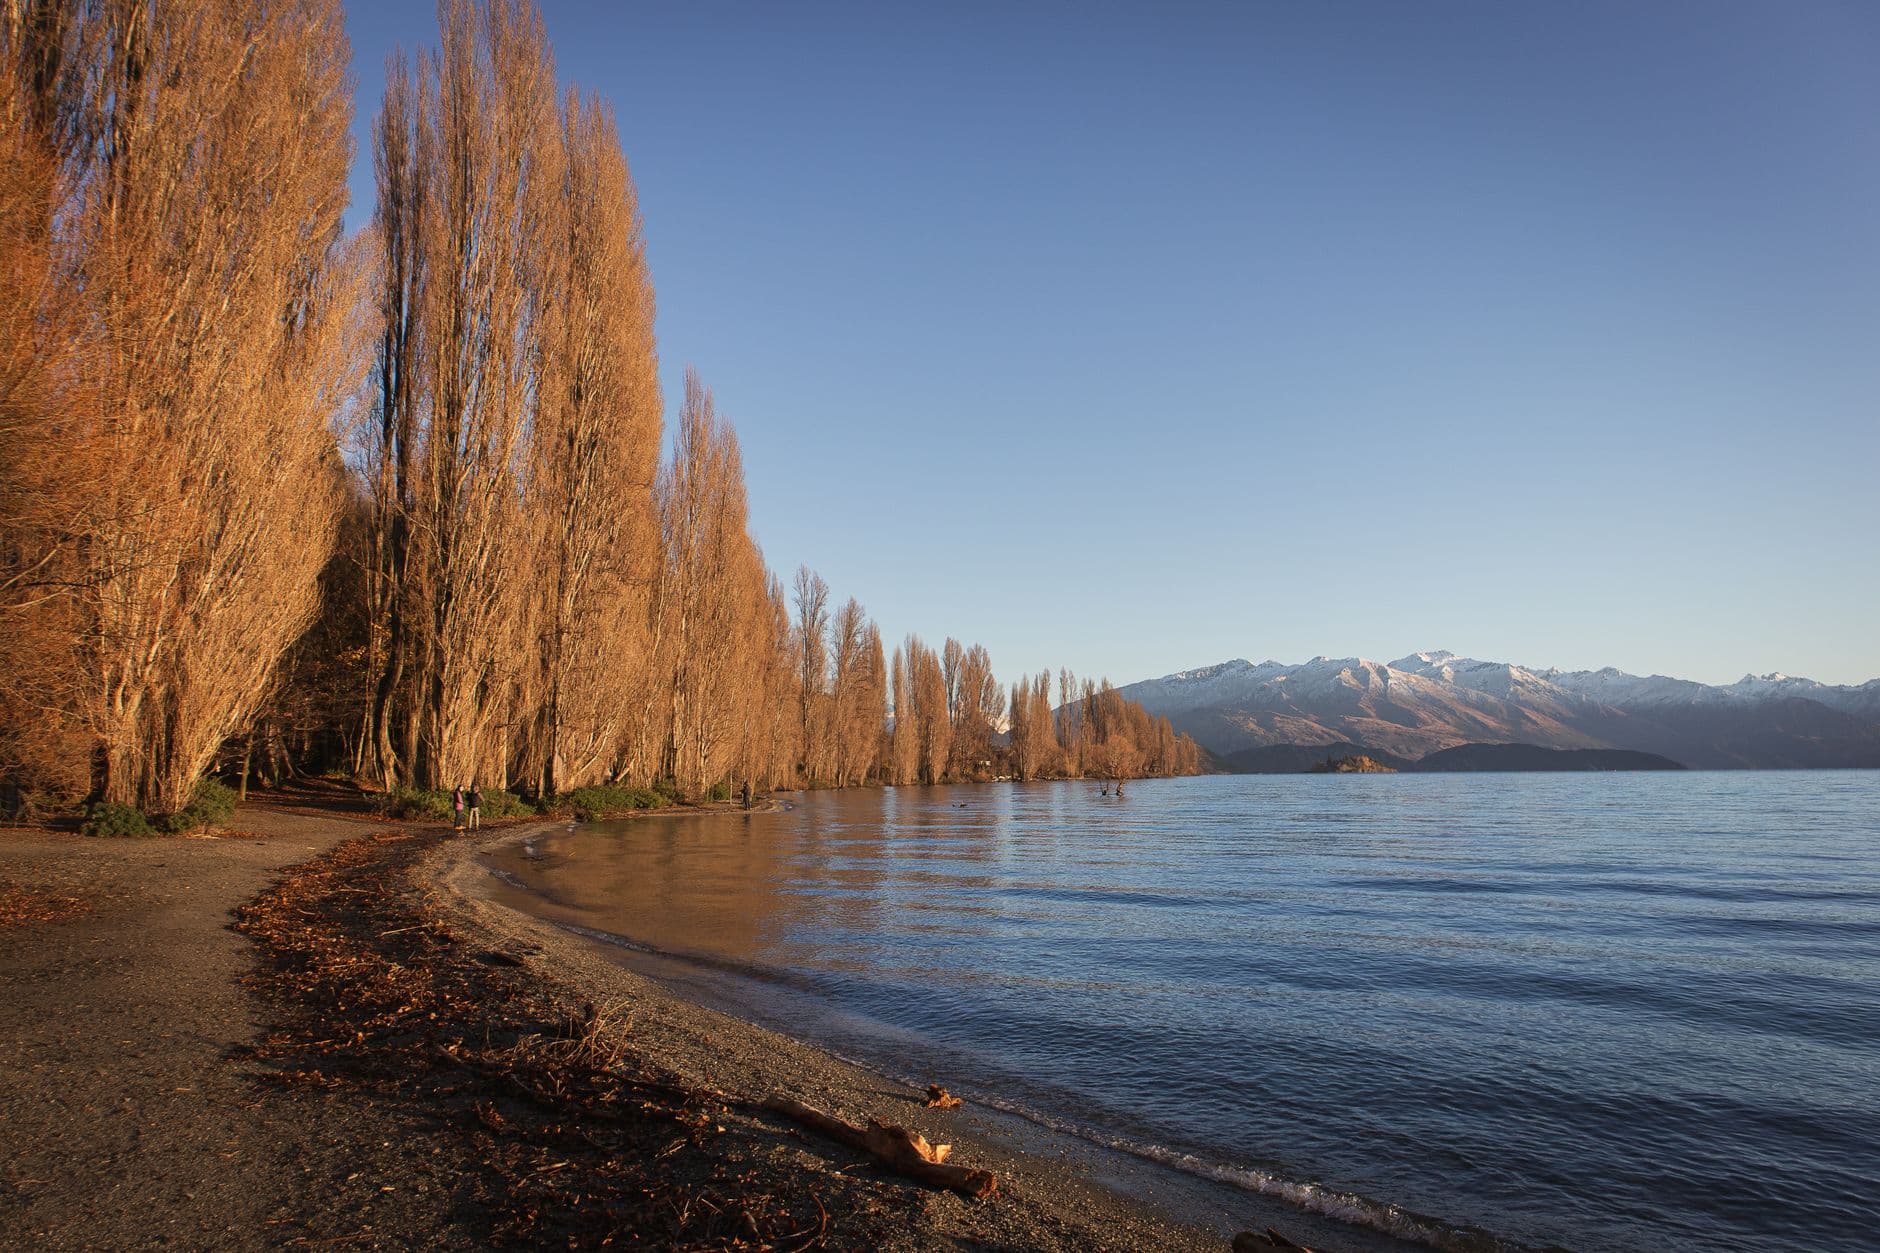
Photo by VISAL VIJAYAN on Pexels
Autumn runs from March to May. It is a transition season: the 1991–2020 mean daily minimums at station 5446 move from 8.6°C in March to 6.0°C in April and 3.7°C in May. The direction matters more than treating any one number as a packing forecast.
Destination Queenstown presents autumn colour as a reason to consider the season. That can change the visual character of a trip, but there is no promise that foliage will peak on a chosen week or look the same across the wider region. Weather systems and local conditions still vary.
Autumn may suit travellers who want the seasonal colour context and are comfortable planning for cooler mornings and evenings as the season advances. March and May should not be treated as interchangeable simply because both sit under the autumn label.
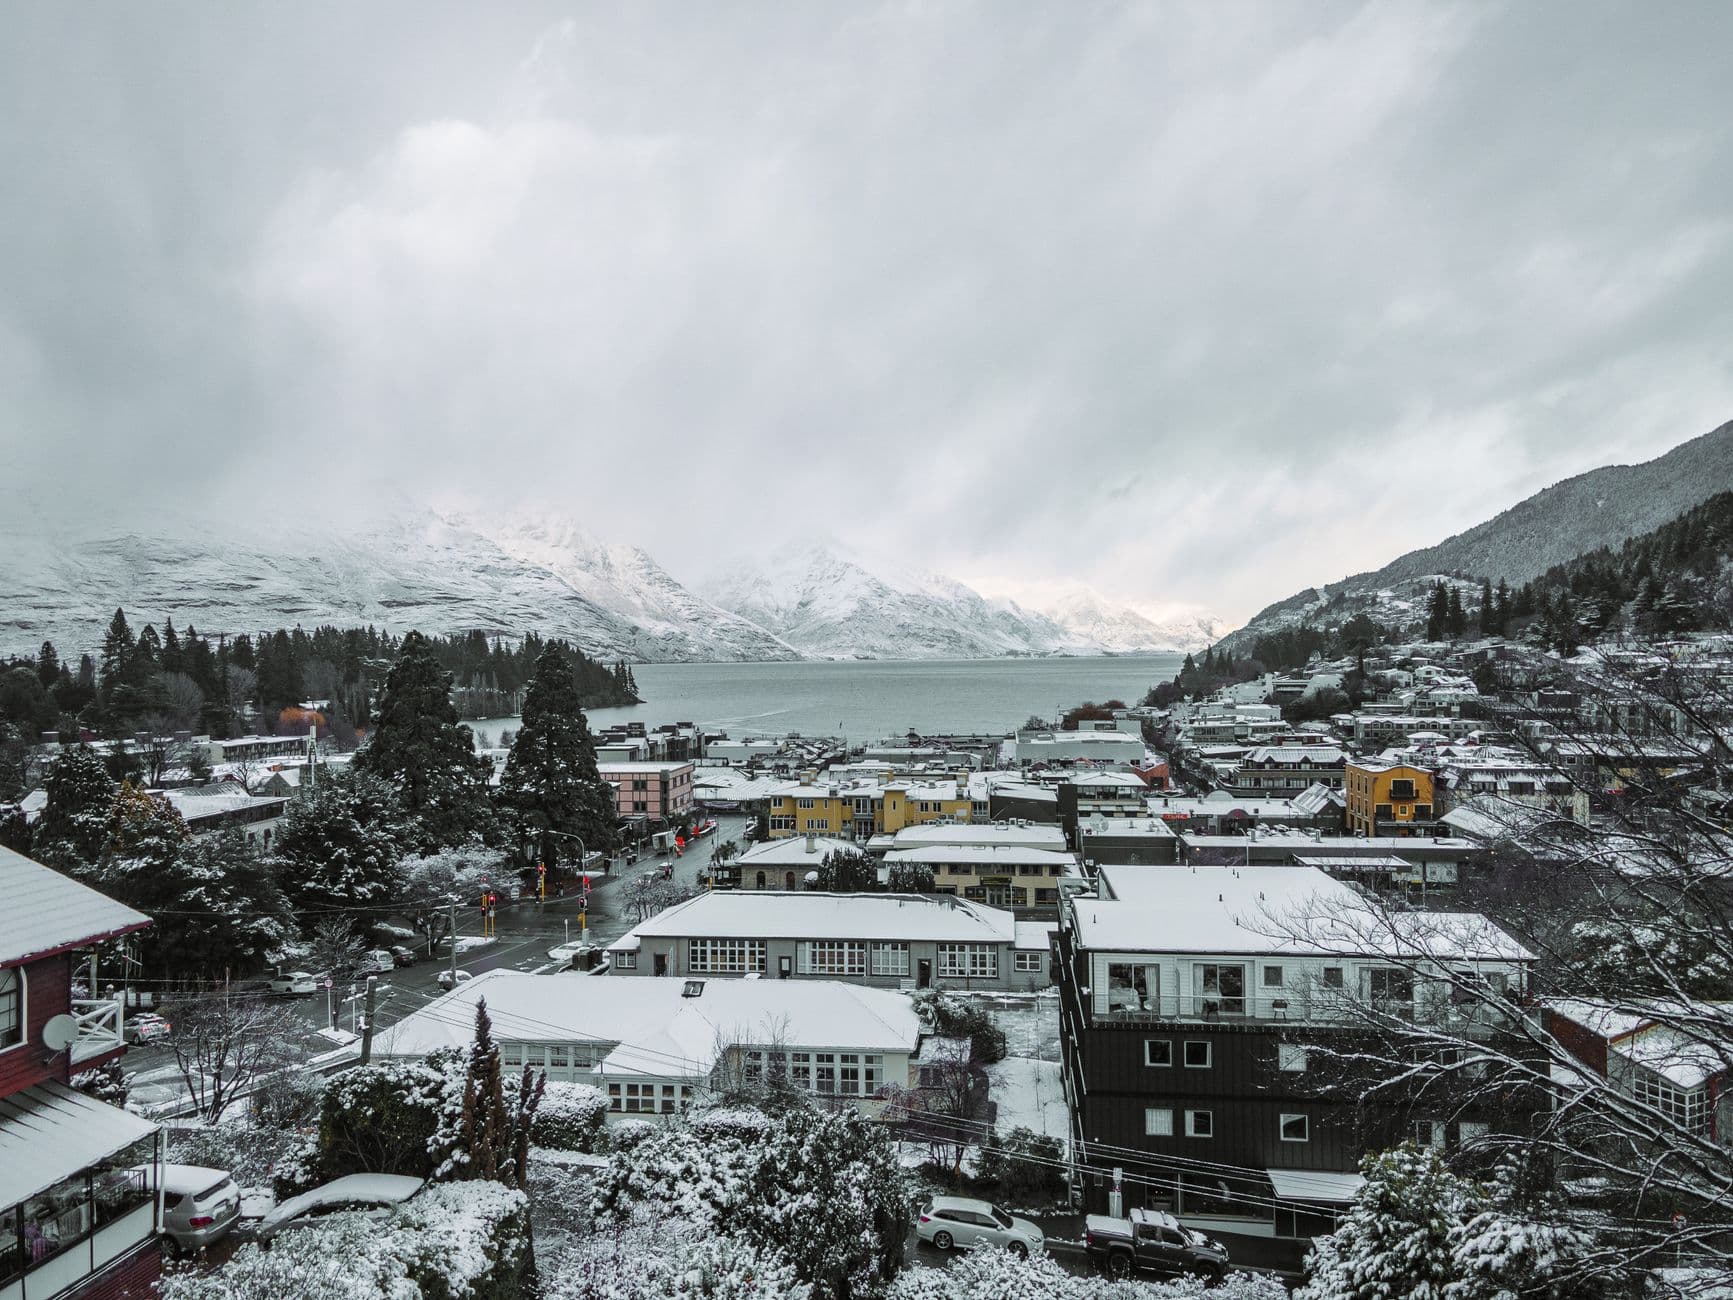
Photo by Kari Kittlaus on Pexels
Winter runs from June to August and is the main snow-sports period. Destination Queenstown describes a typical ski season from around mid-June to early October, but opening dates, closing dates, terrain and snow conditions depend on weather and each field's operations.
At Queenstown station 5446, the 1991–2020 mean daily minimum is 1.1°C in June, 0.2°C in July and 1.6°C in August. These are the coldest values in the annual station series. They explain why winter planning needs proper cold-weather preparation, but they do not describe the temperature on a particular morning or conditions higher on the mountain.
Snow can fall in Queenstown town. It is not guaranteed to be falling—or settled—when you visit. NIWA's regional climate report distinguishes lower-level conditions from seasonal snow in the mountains, where elevation creates a different environment. A snow-covered town photograph shows a real event, not an everyday winter promise.
Spring runs from September to November. The 1991–2020 minimum-temperature series rises from 3.8°C in September to 5.5°C in October and 7.3°C in November. Daylight lengthens, but Destination Queenstown also describes spring weather as changeable.
This is a season where the valley and mountain distinction remains particularly useful. Milder conditions in town do not automatically describe the mountains, and snow-sports operations near the beginning of spring remain dependent on current conditions. Equally, one late cold spell does not define the whole season.
Spring may suit travellers who want increasing daylight and a move towards warmer conditions while accepting a variable transition season. Check what is operating and what the forecast says rather than planning around a fixed idea of spring weather.
Start with winter if snow sports are the priority. The typical ski-season context extends from around mid-June to early October, but that broad window is not an operating calendar. Each ski field publishes its own current status, and weather can change what is available.
Separate three ideas when planning:
If seeing snow is essential, do not rely on a town accommodation booking or a historical average alone. Check current mountain and operator information close to the trip.
Summer is the strongest starting point when long daylight and warmer-season outdoor sightseeing are the priorities. Spring offers lengthening days but more obvious transition-season variability. Autumn adds seasonal colour while typical overnight temperatures move down as winter approaches.
This is broad seasonal planning, not a statement that a trail is open, safe or suitable on a particular day. Conditions can differ between town, valley and mountain locations. Check the current forecast and the information for the specific walk or activity before setting out.
The practical choice is about tolerance as much as temperature. A traveller comfortable carrying layers and adapting a day may find several seasons workable. Someone whose plans depend on a narrow set of conditions should give current information more weight and keep alternatives available.
The table below uses only NIWA Queenstown station 5446, but the two measurements have different normal periods. “Mean daily minimum” is the long-term monthly average of daily minimum temperatures for 1991–2020. Rainfall is the historical monthly total normal for 1981–2010.
| Month | Mean daily minimum — 1991–2020 | Rainfall normal — 1981–2010 | Planning context |
|---|---|---|---|
| January | 11.0°C | 80.5 mm | Summer; long-day outdoor context |
| February | 10.6°C | 61.4 mm | Summer; lowest rainfall normal in this station series |
| March | 8.6°C | 73.1 mm | Early autumn transition |
| April | 6.0°C | 68.5 mm | Cooler autumn conditions |
| May | 3.7°C | 85.6 mm | Late autumn moving towards winter |
| June | 1.1°C | 84.9 mm | Winter and snow-sports context |
| July | 0.2°C | 62.5 mm | Coldest mean daily minimum in the series |
| August | 1.6°C | 82.2 mm | Winter, with current snow conditions still decisive |
| September | 3.8°C | 75.3 mm | Early spring transition |
| October | 5.5°C | 87.6 mm | Spring; highest rainfall normal in this station series |
| November | 7.3°C | 73.8 mm | Late spring moving towards summer |
| December | 9.6°C | 84.8 mm | Summer and long daylight |
The rainfall range is relatively narrow: 61.4–87.6 mm across the monthly normals. It does not support calling one season reliably rain-free. Monthly totals also do not show whether rain fell in brief events or over many days.
No season is a universal winner. The useful decision is which combination of daylight, typical temperatures, snow context and variability best suits the trip you want.
Editorial standards
We checked the factual information on this page against official climate, forecast and destination sources.
Last reviewed: 19 October 2026
Climate normals describe historical periods. Check MetService and relevant operators for current conditions before travel.
Next step
Once you know what you want from the trip and which season best supports it, compare current Queenstown accommodation for your dates.
Choose future dates to compare current accommodation pricing and availability through Expedia.
You’ll continue to Expedia to see its current pricing and availability.